Commentary
Is low volatility ripe for recovery?
August 27, 2024
After two years of runaway inflation and rising interest rates, markets are on the brink of yet another factor rotation. To guide institutional investors through the transition, Lu Lin, Head, Quantitative Investments and Strategic Optimization at BMO Global Asset Management, explores the outlook and opportunities for low volatility strategies.
Earlier this summer, the Bank of Canada (BOC) broke ranks with major central banks by twice cutting its benchmark interest rate by 25 basis points.1 The move signaled a possible end to inflation-era monetary policy—a two-year span of rising interest rates that posed significant headwinds for low volatility equity strategies. Will this change in direction bring low vol’s temporary weakness to an end?
Here is what the data shows: A recent study found that an average of all Canadian low vol strategies’ returns trailed the S&P TSX by 3.7% specifically during rate hiking cycles.2 By contrast, in any other environment, Canadian low volatility outperformed the benchmark by 11.3%.3 The same stood true for U.S. low volatility strategies, which beat the S&P 500 Index by 8.3% in ex-rising rate scenarios, and for Global, where low vol fared better than other factors in a falling rate environment.4
Low vol performance relative to market – by rate rise and ex-rise periods – Canada and U.S.
Over periods of rate rise or ex-rise periods
Region and period type | Incidence of outperformance | % of outperformance | Average of total returns | Average of total returns vs. benchmark | Median of total returns | Median of total returns vs. benchmark |
|---|---|---|---|---|---|---|
Canada (S&P/TSX) |
|
| ||||
Rising rate period | 3 | 17.6% | 4.9% | -3.7% | 4.3% | -2.4% |
Ex-rise rate period | 10 | 62.5% | 12.6% | 11.3% | 11.3% | 6.3% |
Current (since Oct. 19, 2019) | – | – | 15.7% | -4.4% | – | – |
U.S. (S&P 500) | ||||||
Rising rate period | 3 | 17.6% | 2.9% | -6.8% | 3.6% | -5.9% |
Ex-rise rate period | 11 | 68.8% | 12.9% | 8.3% | 8.1% | 2.9% |
Current (since Oct. 19, 2019) | – | – | 10.4% | -9.1% | – | – |
Source: Compustat, FactSet, CIBC World Markets Inc. Note: 17 rate rise periods, 16 ex-rise periods since 2000.
Across geographies, the data suggests that the specific dynamics of 2022 and 2023 were uniquely poor for lower beta strategies. However, with the BoC now reversing course and taking a step towards normalization, a different paradigm will soon set in.
The good news is that low volatility funds have historically performed well outside of upward rate cycles. Since the year 2000, total returns averaged 12.6% annually whenever central banks either cut or paused, beating the S&P/TSX Index by 11.3%.5 This can be observed in the pre-Financial Crisis environment where rates were fairly normal, plus a range of other scenarios including the Great Recession, Zero Interest Rate Policy (ZIRP) era and Covid years. So, despite the recent sluggishness, the return to normalcy, where interest rates hover above zero and below 4%, is where the data suggests low volatility will thrive.
Choosing a low volatility approach
Asset owners looking to invest in low vol portfolios should be careful not to confuse the idea with “minimum volatility.” The goal is not to blindly cut risk at the expense of returns, but rather to optimize the Sharpe ratio below a certain threshold of risk.
In our BMO AM Canadian Smart Alpha Equity Fund, for example, we can move anywhere along the efficient frontier of risk-return tradeoffs. If the cost of a particular security or sector carries slightly more uncertainty, we are willing to consider investing provided the incremental returns are worthwhile. On the other hand, if the holding comes at too high a price, we will steer clear. The differentiator is that our acceptable level of cost (read: risk) is lower than you would expect to find in active Canadian equity strategies.
The process for security selection can also widely differ from one offering to another. There are “pure” low vol funds that screen for beta and little else, while other strategies ingest more data in pursuit of the same goal. Our approach falls into the latter camp. We designed an active multi-factor model that seeks to reduce volatility and optimize long-term performance by tracking a range of signals—from momentum to sentiment.
The good news is that low volatility funds have historically performed well outside of upward rate cycles. Since the year 2000, total returns averaged 12.6% annually whenever central banks either cut or paused.
The process is both iterative and highly scientific, hence the “smart” in our BMO AM Canadian Smart Alpha Equity Fund. It refers to a proprietary research-driven model that blends fundamental and quantitative insights. First, the fund aggregates the data needed to judge a security’s attractiveness. Then it runs proprietary sector models, analyzes the security through multiple perspectives, checks for broader portfolio issues, and allows for a final PM review to unearth any hidden tail risks. This disciplined approach is what enables the fund to potentially exceed the benchmark’s return—a feat it has accomplished since inception.
In fact, the strategy has consistently delivered on three core mandates: alpha generation, risk control and yield. Its 9.25% annualized total returns since inception (June 17, 2011) have surpassed the benchmark by 2.16%, yet the portfolio has also maintained a 0.83 beta.6 For added benefit, the reduced volatility and excess returns are complemented by cash flow: a 3.6% annualized yield since inception that is delivered consistently through high-quality portfolio holdings.
Case study: a diamond in the ruff
How does the portfolio manage to hit all three targets—risk control, alpha generation and solid cash flow? The answer goes to the root of the strategy: that lower risk stocks tend to “win” by avoiding losses. They also tend to be underappreciated by asset managers for reasons that have nothing to with their fundamental value.For example, Hydro One, a utility company, is a portfolio holding that exemplifies the low volatility anomaly in action. We have held the stock for more than six years, yet in all that time, sellside analysts lacked any belief in the company. We saw this trend manifest in two measures:
“Hold” was the most common rating on the stock, denoted by light blue bars in the table below.
The low-price return, as shown in the narrow gap between the red price and dark blue target lines below.
What we saw was a company with stable-but-growing earnings, an expert management team, a reasonable valuation and, of course, a low beta profile. Sellside analysts, meanwhile, preferred cheaper and lower quality companies where alpha could be generated only if the caliber of the company or its earnings improved. In effect, they wanted to chase potentially higher returns rather than be satisfied with performance that was merely good—even if those results were far more likely.
Hydro One analyst recommendations and performance history
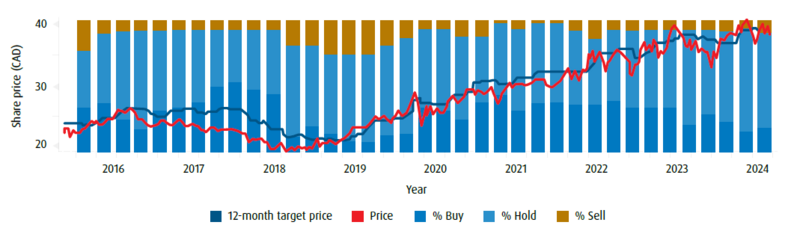
Source: BMO Asset Management Inc., Bloomberg as of June 30, 2024.
Evolving our proprietary sector model
As active managers, we have always paid attention to the individual security selection within the sectors we find compelling. Now, based on robust research and back-testing, our team has implemented an updated model for disciplined sector rotation.
We undertook this change for several reasons. First, because investors are increasingly buying indexed strategies when entering a sector and our analysis shows there is alpha to be generated from moving not only at the right time, but also into a curated set of stocks. Second, we noticed our outperformance was optimal at the individual stock level, but was lagging on the sector overlay given our underweight exposure to Energy and our overweight to Communication Services, Utilities and Consumer Staples.
These sectors are staples in low vol portfolios, but our weightings need not have been as high. Sector allocation has become a more critical alpha source with the rise of ETF investing, and to ensure we optimize returns, we have enhanced our model accordingly.
Key takeaway
When examining low volatility portfolios, it is important to consider their inherent mandate. They do not seek to outperform the market over one cycle, but rather multiple cycles. By losing less on the market’s downswings, and keeping relative pace on the upswings, the strategy can optimize long-term performance instead of chasing gains in any particular year. In other words, while timing is irrelevant to low volatility, time itself is essential.
Please contact your BMO Institutional Sales Partner for additional market insights.
BMO AM Canadian Smart Alpha Fund | Total return | Benchmark total return | Active return |
Current quarter | 0.16% | -0.53% | 0.70% |
Year-to-date | 4.51% | 6.05% | -1.54% |
Trailing 6-months | 4.51% | 6.05% | -1.54% |
Trailing 1-year | 9.41% | 12.13% | -2.72% |
Trailing 2-years | 8.68% | 11.27% | -2.59% |
Trailing 3-years | 5.81% | 5.98% | -0.17% |
Trailing 4-years | 11.37% | 12.35% | -0.97% |
Trailing 5-years | 8.31% | 9.28% | -0.97% |
Trailing 7-years | 8.39% | 8.65% | -0.26% |
Trailing 10-years | 8.58% | 6.95% | 1.63% |
Annualized since inception | 9.25% | 7.10% | 2.16% |
Insights
Sources
1Bank of Canada, Bank of Canada reduces policy rate by 25 basis points, June 5, 2024.
2Compustat, FactSet, CIBC World Markets Inc. Note: 17 rate rise periods, 16 ex-rise periods since 2000.
3Compustat, FactSet, CIBC World Markets Inc. Note: 17 rate rise periods, 16 ex-rise periods since 2000.
4Compustat, FactSet, CIBC World Markets Inc. Note: 17 rate rise periods, 16 ex-rise periods since 2000.
5Compustat, FactSet, CIBC World Markets Inc. Note: 17 rate rise periods, 16 ex-rise periods since 2000.
6Series I performance data as of June 30, 2024. See standard performance data below.
Disclaimers
For Institutional Client Use Only
Index returns do not reflect transactions costs or the deduction of other fees and expenses and it is not possible to invest directly in an Index. Past performance is not indicative of future results.
Certain of the products and services offered under the brand name BMO Global Asset Management are designed specifically for various categories of investors in a number of different countries and regions and may not be available to all investors. Products and services are only offered to such investors in those countries and regions in accordance with applicable laws and regulations.
This communication is intended for informational purposes only and is not, and should not be construed as, investment, legal or tax advice to any individual. Particular investments and/or trading strategies should be evaluated relative to each individual’s circumstances. Individuals should seek the advice of professionals, as appropriate, regarding any particular investment. Past performance does not guarantee future results.
All figures and statements are as of month end unless otherwise indicated. Performance is calculated before the deduction of management fees. Past performance is no guarantee of future results.
The information provided herein does not constitute a solicitation of an offer to buy, or an offer to sell securities nor should the information be relied upon as investment advice. All investing involves risk, including the potential loss of principal. Past performance is not a guarantee of future results.
Certain statements included in this material constitute forward-looking statements, including, but not limited to, those identified by the expressions “expect”, “intend”, “will” and similar expressions. The forward-looking statements are not historical facts but reflect BMO AM’s current expectations regarding future results or events. These forward-looking statements are subject to a number of risks and uncertainties that could cause actual results or events to differ materially from current expectations.
Although BMO AM believes that the assumptions inherent in the forward-looking statements are reasonable, forward-looking statements are not guarantees of future performance and, accordingly, readers are cautioned not to place undue reliance on such statements due to the inherent uncertainty therein. BMO AM undertakes no obligation to update publicly or otherwise revise any forward-looking statement or information whether as a result of new information, future events or other such factors which affect this information, except as required by law.
All Rights Reserved. The information contained herein: (1) is confidential and proprietary to BMO Asset Management Inc. (“BMO AM”); (2) may not be reproduced or distributed without the prior written consent of BMO AM; and (3) has been obtained from third party sources believed to be reliable but which have not been independently verified. BMO AM and its affiliates do not accept any responsibility for any loss or damage that results from this information.
BMO Global Asset Management is a brand name under which BMO Asset Management Inc. and BMO Investments Inc. operate.
“BMO (M-bar roundel symbol)” is a registered trademark of Bank of Montreal, used under licence.