
Since early 2022, public market volatility has forced plan sponsors to contend with the Denominator Effect, limiting their ability to rebalance and put new capital to work. In this article, Mark Webster, Director ETF Distribution, Institutional & Advisory, BMO Global Asset Management, outlines the challenges plans are facing and suggests a solution in the form of an allocation to liquid public assets.
Denominator Effect
Like a seesaw in a park, the denominator effect may require a mere market push off the bottom to correct itself. For the child dangling in the air, waiting for the balance to be restored, there is a feeling of helplessness. Asset owners may have the same discomfort when evaluating how to address the Denominator Effect, which occurs when private assets exceed their recommended proportion to public assets. The effect could be transient, like Eeyore’s “here today, gone tomorrow” dismissal, but what if it persists and causes divisiveness amongst plan sponsors and their trustees?
Most of the discussion about the Denominator Effect centres on the imbalance that invariably occurs when listed asset valuations decline, seemingly distorting asset allocation models and possibly contravening policies. The numerator declines because public assets are priced at fair market value while unlisted, illiquid private assets in the denominator seem to hover on the horizon, weightless, because they do not mark-to-market.
Part of the problem lies in the difference between the way listed and unlisted assets are priced, the former transparently in the market and the latter subjectively and, to be frank, rather variably. Unlike the generally accepted accounting principles (GAAP) used for accounting practices in public securities, which the market takes into account, there are valuation idiosyncrasies across private markets managers.
The real problem, however, is not their valuation, but their inherent illiquidity. When the denominator exceeds its acceptable range, the illiquidity of private assets makes things difficult to fix quickly.
An Ounce of Prevention
- Do nothing, hoping the Effect is transient, soon rectified by a rebounding public market. The Credit Crisis, with its rather sharp “V” recovery, was a great example of how a market can rebound quickly, something we saw again during the COVID rebound, both of which were beneficiaries of very accommodating rates. In contrast, 2000-2002 was excruciating, testing everyone’s resolve and patience;
- Sell your most stable, prized and liquid unlisted assets to correct the imbalance. This may require queuing up alongside other investors to redeem from funds that offer you the most favorable exit terms or choosing to dispose of assets directly into the secondary market. If this is possible (people must remember the real estate funds which froze redemptions during the Credit Crisis), it may incur significant cost, both present and possibly future—in addition to delays in putting new capital to work. Private assets are also often acquired at a premium, which institutions willingly pay because they covet the reporting stability associated with investments that do not mark-to-market. When these assets are sold in a secondary market, however, they could be done at a distasteful discount, possibly calculated by an opaque methodology. Does good plan governance condone buying at a premium yet selling at a discount? Another consideration is that selling funds holding private assets may reduce access to future ‘vintages’ from the same provider, presenting yet another risk;
- Increase funding to public assets to correct the imbalance. This introduces an additional stress on the plan sponsor, an unsavoury proposition for public plans and private plans alike.
The easiest solution is to take steps to avoid a problem occurring. Private investments in real assets like infrastructure, real estate, commodities and agriculture, and private assets in debt or equity provide great diversification to traditional assets like public debt or equity. It is possible, however, to replicate similar risk and return profiles using liquid public assets, lowering costs and using a rich data set to model risk to plan objectives.
Like Dickens’ Artful Dodger, savvy investors can allocate assets to these liquid facsimiles, creating similar profiles to their illiquid counterparts, yet avoiding the operational impediments illiquidity poses when the denominator effect is triggered.
Yes, there may be reporting variability, but these should be evaluated in a balanced manner, examining the advantages liquid positions can bring to total portfolio management. Complementary allocations can help to even out both sides of the ledger, providing flexibility and opportunity.
Capturing the diversification properties private assets provide in the numerator, through liquid facsimiles, may minimize the probability of the Denominator Effect’s occurrence. There are several observable benefits:
- Listed assets provide a rich data set to model risk and return more accurately. Unlisted assets are highly idiosyncratic, reducing the ability to assess their suitability;
- Listed assets provide liquidity and capacity whereas illiquid alternatives have liquidity and capacity constraints. Operationally, listed assets provide flexibility that is not possible with unlisted assets;
- Total cost of ownership for listed assets is fractional to the cost for unlisted assets. In addition, if accessing listed assets through an ETF vehicle in particular, institutions may earn lending premium, further reducing the cost of ownership.
Real Assets
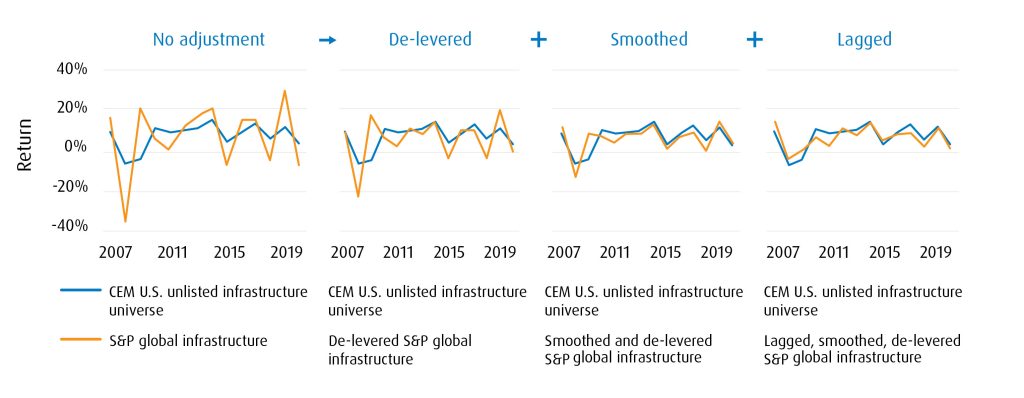
The differences between listed and unlisted infrastructure is much less dramatic once slight adjustments are made to account for leverage and for reporting lags.
Listed infrastructure resembles unlisted infrastructure once you adjust for leverage, smoothing and lag
Positive |
|
|
|
|
Challenge |
|
|
|
|
Source: CEM Benchmarking Inc. Returns are gross of fees.
Making simple adjustment for key elements reveals there is very little difference in the long-term profiles of listed and unlisted infrastructure:
- Leverage – leverage is higher in listed assets than in unlisted assets;
- Data relevancy – new data, in isolation, may not be relevant (house price example). Only time will tell;
- Reporting lags – market priced transparently daily/unlisted market priced idiosyncratically quarterly/annually
The assumed long-term preference for unlisted assets evaporates under scrutiny.
Over the long-term, the two infrastructure plays almost overlay one another. Combining the two may actually strengthen the benefits infrastructure can bring to portfolio construction:
Unlisted Infrastructure | Listed Infrastructure | |
|---|---|---|
Reporting | No Mark-to-Market | Marks-to-Market |
Premium/Fair Market Value | Premium | Fair Market Value |
Liquidity, Capacity & Scalability | No | Yes |
Data Set | Idiosyncratic | Broad & Deep |
Cost | Fairly expensive | Fairly inexpensive |
As the chart below reveals, listed pure-play infrastructure has appealingly high margins, akin to what institutional investors hope to reap in unlisted investments:
Global Infrastructure: Historically strong and consistent operating margins (2013 – 2023)
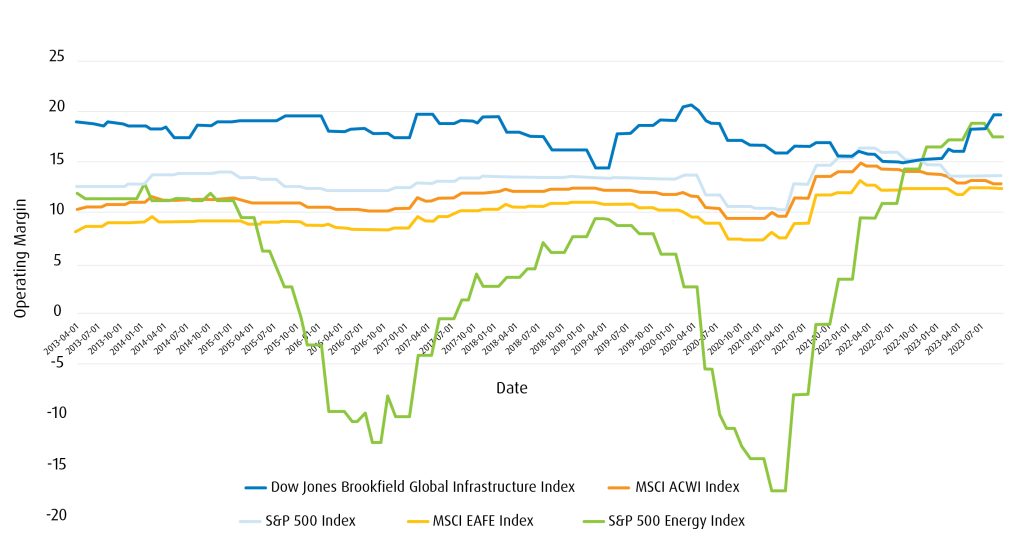
Source: BMO Global Asset Management, as of September 30, 2023. Returns are gross of fees.
Unlisted infrastructure is prized for its inflation buffering attributes, but similar properties are also achievable in listed equivalents:
Global Listed Infrastructure vs CPI+4% – returns to December 31, 2022
Source: BMO Global Asset Management, as of September 30, 2023. Returns are gross of fees.
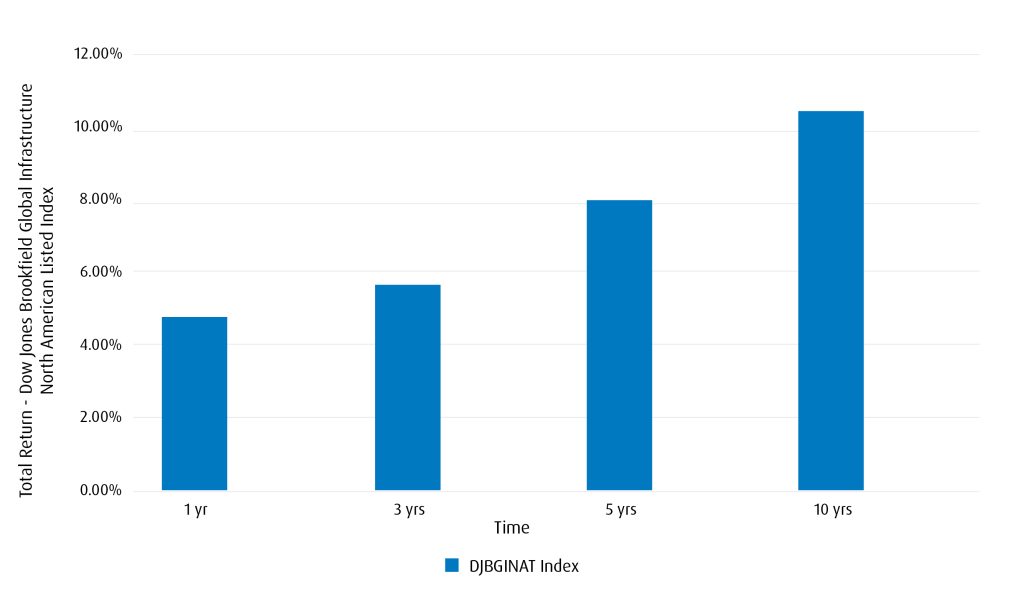
Dow Jones Brookfield Global Infrastructure North American Listed
Performance during periods of Inflation >3%
Average Monthly Returns – Inflation > 3%
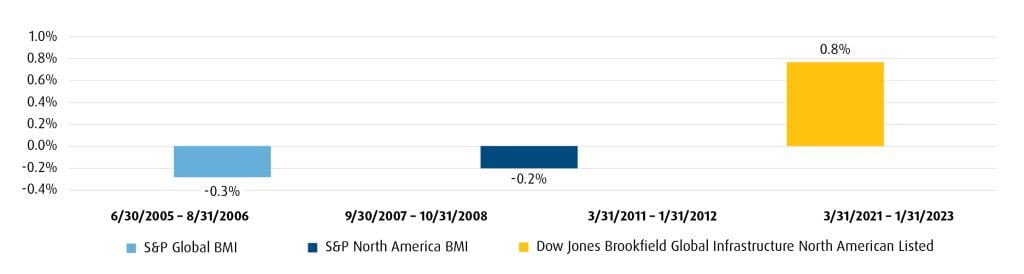
Source: S&P Dow Jones Indices. Returns are gross of fees. Data from December 31, 2022 to January 31, 2023. Index performance based on monthly total return in USD. Past performance is no guarantee of future results. Chart is provided for illustrative purposes and reflects hypothetical historical performance.
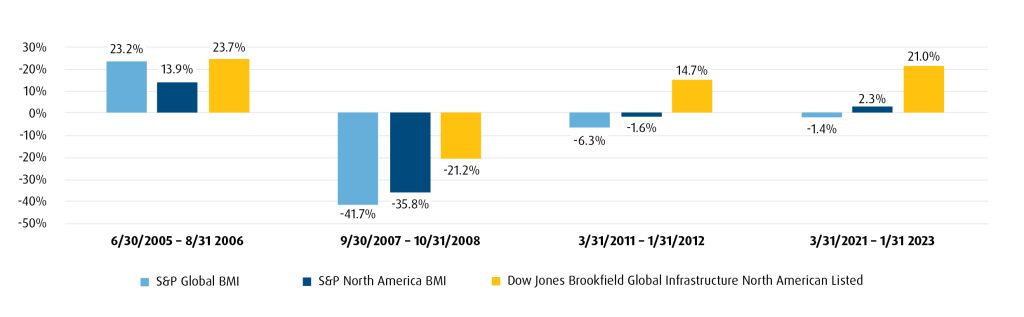
The same case can be made in real estate, another asset where liquidity is extremely limited. Listed real estate provides the same attractive margins institutional investors seek in unlisted assets but does so with a much different liquidity profile.
Open-ended, two-way liquidity is extremely valuable in real assets, providing more control, an ability to allocate when valuations are at a discount and to rebalance as required to maintain asset mix targets.
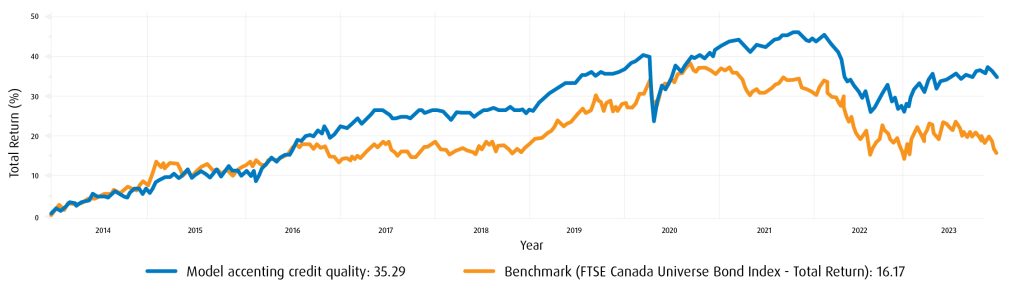
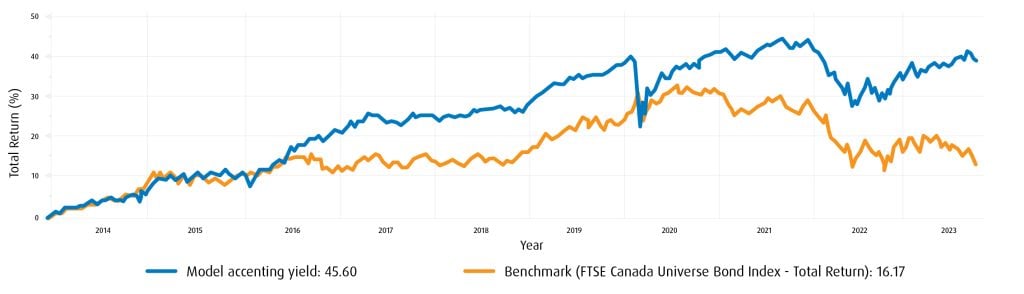
Private Debt
Similarly, it is possible to construct a complementary model using non-core public fixed income securities to provide some of the diversification properties associated with private debt. There are several key advantages:
- Public securities provide a broad and deep data set to more accurately model risk and return. Private debt exposure is highly idiosyncratic, which is why there is so much discussion about suitable benchmarks;
- Institutions can manage credit quality and liquidity using public debt.
Our simple models use four ETFs:
- ZBBB: Canadian BBB-rated corporate bonds (to manage credit quality);
- ZEF: Debt-to-GDP weighted emerging market bonds, Hedged to CAD (2/3rds investment grade);
- ZFH: Floating rate high yield (synthetic exposure provides deep liquidity);
- ZHY: U.S. high yield.
1. Model accenting credit quality:
- ZBBB & ZEF: 30% each
- ZFH & ZHY: 20% each
- BM: FTSE Canada Universe Bond Index – Total Return
- Rebalancing Frequency: Monthly
3 Months | 6 Months | Year To Date | 1 Year | |||||
|---|---|---|---|---|---|---|---|---|
Portfolio Statistics | Portfolio | Benchmark | Portfolio | Benchmark | Portfolio | Benchmark | Portfolio | Benchmark |
Return | ||||||||
Total Return | -0.17 | -4.18 | 0.30 | -5.99 | 2.96 | -2.09 | 5.37 | -2.08 |
Maximum Return | 0.61 | 1.15 | 0.61 | 1.15 | 0.62 | 1.23 | 1.23 | 1.87 |
Minimum Return | -0.64 | -1.34 | -0.64 | -1.34 | -0.64 | -1.34 | -0.64 | -1.37 |
Mean Return (Annualized) | -0.82 | -20.73 | 0.93 | -15.48 | 5.63 | -3.40 | 7.71 | -2.45 |
Mean Excess Return (Annualized) | 25.10 | 19.41 | 9.36 | 10.41 | ||||
Risk | ||||||||
Standard Deviation (Annualized) | 3.79 | 7.49 | 3.43 | 7.51 | 3.70 | 7.84 | 4.06 | 8.19 |
Downside Risk (Annualized) | 2.56 | 5.33 | 2.36 | 5.30 | 2.52 | 5.47 | 2.75 | 5.65 |
Skewness | 0.29 | 0.00 | 0.20 | 0.03 | 0.23 | 0.10 | 0.44 | 0.24 |
VaR 95% (Ex-Post) | -0.34 | -0.81 | -0.35 | -0.78 | -0.35 | -0.78 | -0.37 | -0.78 |
Tracking Error (Annualized) | 4.75 | 5.07 | 5.46 | 5.61 | ||||
Risk/Return | ||||||||
Sharpe Ratio | -1.47 | -2.71 | -1.21 | -2.15 | -0.19 | -0.91 | 0.23 | -0.77 |
Jensen Alpha | 3.09 | 1.92 | 1.92 | 3.38 | ||||
Information Ratio | 3.66 | 2.67 | 1.21 | 1.31 | ||||
Treynor Measure | -0.13 | -0.11 | -0.02 | 0.02 | ||||
Beta (Ex-Post) | 0.43 | 0.38 | 0.37 | 0.39 | ||||
Correlation | 0.8435 | 0.8234 | 0.7805 | 0.7847 | ||||
Capture Ratio | 0.39 | 0.35 | 0.42 | 0.37 |
Source: Bloomberg, as of October 4, 2023. Returns are gross of fees and taxes. Past Performance is not indicative of future results.
- ZFH & ZHY: 30% each
- ZBBB & ZEF: 20% each
- BM: FTSE Canada Universe Bond Index – Total Return
- Rebalancing Frequency: Monthly
3 Months | 6 Months | Year To Date | 1 Year | |||||
|---|---|---|---|---|---|---|---|---|
Portfolio Statistics | Portfolio | Benchmark | Portfolio | Benchmark | Portfolio | Benchmark | Portfolio | Benchmark |
Return | ||||||||
Total Return | 0.44 | -4.18 | 1.43 | -5.99 | 4.08 | -2.09 | 6.94 | -2.08 |
Maximum Return | 0.60 | 1.15 | 0.60 | 1.15 | 0.72 | 1.23 | 1.27 | 1.87 |
Minimum Return | -0.61 | -1.34 | -0.61 | -1.34 | -0.66 | -1.34 | -0.66 | -1.37 |
Mean Return (Annualized) | 2.58 | -20.73 | 4.11 | -15.48 | 7.77 | -3.40 | 9.98 | -2.45 |
Mean Excess Return (Annualized) | 29.38 | 23.17 | 11.56 | 12.74 | ||||
Risk | ||||||||
Standard Deviation (Annualized) | 3.65 | 7.49 | 3.44 | 7.51 | 3.91 | 7.84 | 4.32 | 8.19 |
Downside Risk (Annualized) | 2.51 | 5.33 | 2.41 | 5.30 | 2.65 | 5.47 | 2.92 | 5.65 |
Skewness | 0.15 | 0.00 | 0.04 | 0.03 | 0.27 | 0.10 | 0.42 | 0.24 |
VaR 95% (Ex-Post) | -0.36 | -0.81 | -0.34 | -0.78 | -0.34 | -0.78 | -0.38 | -0.78 |
Tracking Error (Annualized) | 5.10 | 5.59 | 6.27 | 6.40 | ||||
Risk/Return | ||||||||
Sharpe Ratio | -0.87 | -2.71 | -0.55 | -2.15 | 0.20 | -0.91 | 0.59 | -0.77 |
Jensen Alpha | 4.69 | 3.41 | 2.96 | 4.62 | ||||
Information Ratio | 3.96 | 2.87 | 1.30 | 1.40 | ||||
Treynor Measure | -0.08 | -0.06 | 0.03 | 0.08 | ||||
Beta (Ex-Post) | 0.39 | 0.33 | 0.30 | 0.33 | ||||
Correlation | 0.7939 | 0.7147 | 0.6092 | 0.6344 | ||||
Capture Ratio | 0.42 | 0.39 | 0.43 | 0.36 |
The exposure and return profiles show considerable diversification to core fixed income, fulfilling some of the aspirations institutions have for private debt. In contrast to private debt, these exposures provide liquidity daily, in and out, and carry fractional management costs.
Conclusion
Moving some private risk assets from unlisted to listed markets, from the denominator to the numerator, may broaden the data set, increase liquidity and capacity and reduce costs.
If you believe publicly listed assets can help to implement a total portfolio approach, bringing more data and more flexibility to the equation, the biggest decision is how much to allocate to liquid, public assets to complement your true private markets?
To offer constructive benefits, the allocation should be meaningful, though it will vary from one plan to another. Some of the most obvious guidelines will be plan maturity, solvency, governance structure and resourcing.
Just as private markets allocations vary widely by plan size and resources, so too should the application of liquid publicly listed proxies. It is not a case of one solution being better than another; they are different and complementary approaches with their own benefits and limitations, but it is our belief that in the Artful Dodger’s hands, pension plans can exert more control by making the case of an allocation to publicly listed assets to mimic private asset returns.
Please contact your BMO Institutional Sales Partner to learn more.
Footnotes
1 Core: an indirect exposure which may be economically sensitive and open to competition, e.g.: railways and other service providers; Broad: related businesses which may be economically sensitive and open to competition, e.g.: construction and communications; Pure-Play: display the highest similarity to unlisted Infrastructure. Direct ownership and operation of infrastructure assets producing cash flows.↩
Not intended for distribution outside of Canada.
The viewpoints expressed by the author represents their assessment of the markets at the time of publication. Those views are subject to change without notice at any time. The information provided herein does not constitute a solicitation of an offer to buy, or an offer to sell securities nor should the information be relied upon as investment advice. Past performance is no guarantee of future results. This communication is intended for informational purposes only.
Certain of the products and services offered under the brand name BMO Global Asset Management are designed specifically for various categories of investors in a number of different countries and regions and may not be available to all investors. Products and services are only offered to such investors in those countries and regions in accordance with applicable laws and regulations.
This communication is intended for informational purposes only and is not, and should not be construed as, investment, legal or tax advice to any individual. Particular investments and/or trading strategies should be evaluated relative to each individual’s circumstances. Individuals should seek the advice of professionals, as appropriate, regarding any particular investment. Past performance does not guarantee future results.
Any statement that necessarily depends on future events may be a forward-looking statement. Forward-looking statements are not guarantees of performance. They involve risks, uncertainties and assumptions. Although such statements are based on assumptions that are believed to be reasonable, there can be no assurance that actual results will not differ materially from expectations. Investors are cautioned not to rely unduly on any forward-looking statements. In connection with any forward-looking statements, investors should carefully consider the areas of risk described in the most recent simplified prospectus.
All figures and statements are as of month end unless otherwise indicated. Performance is calculated before the deduction of management fees. Past performance is no guarantee of future results.
BMO Global Asset Management is a brand name under which BMO Asset Management Inc. and BMO Investments Inc. operate.
®/™Registered trademarks/trademark of Bank of Montreal, used under licence.